The company needed ROI proof. I needed to make the product worth buying. Three operator problems drove every major design decision.
The Problem
Solving business with interest
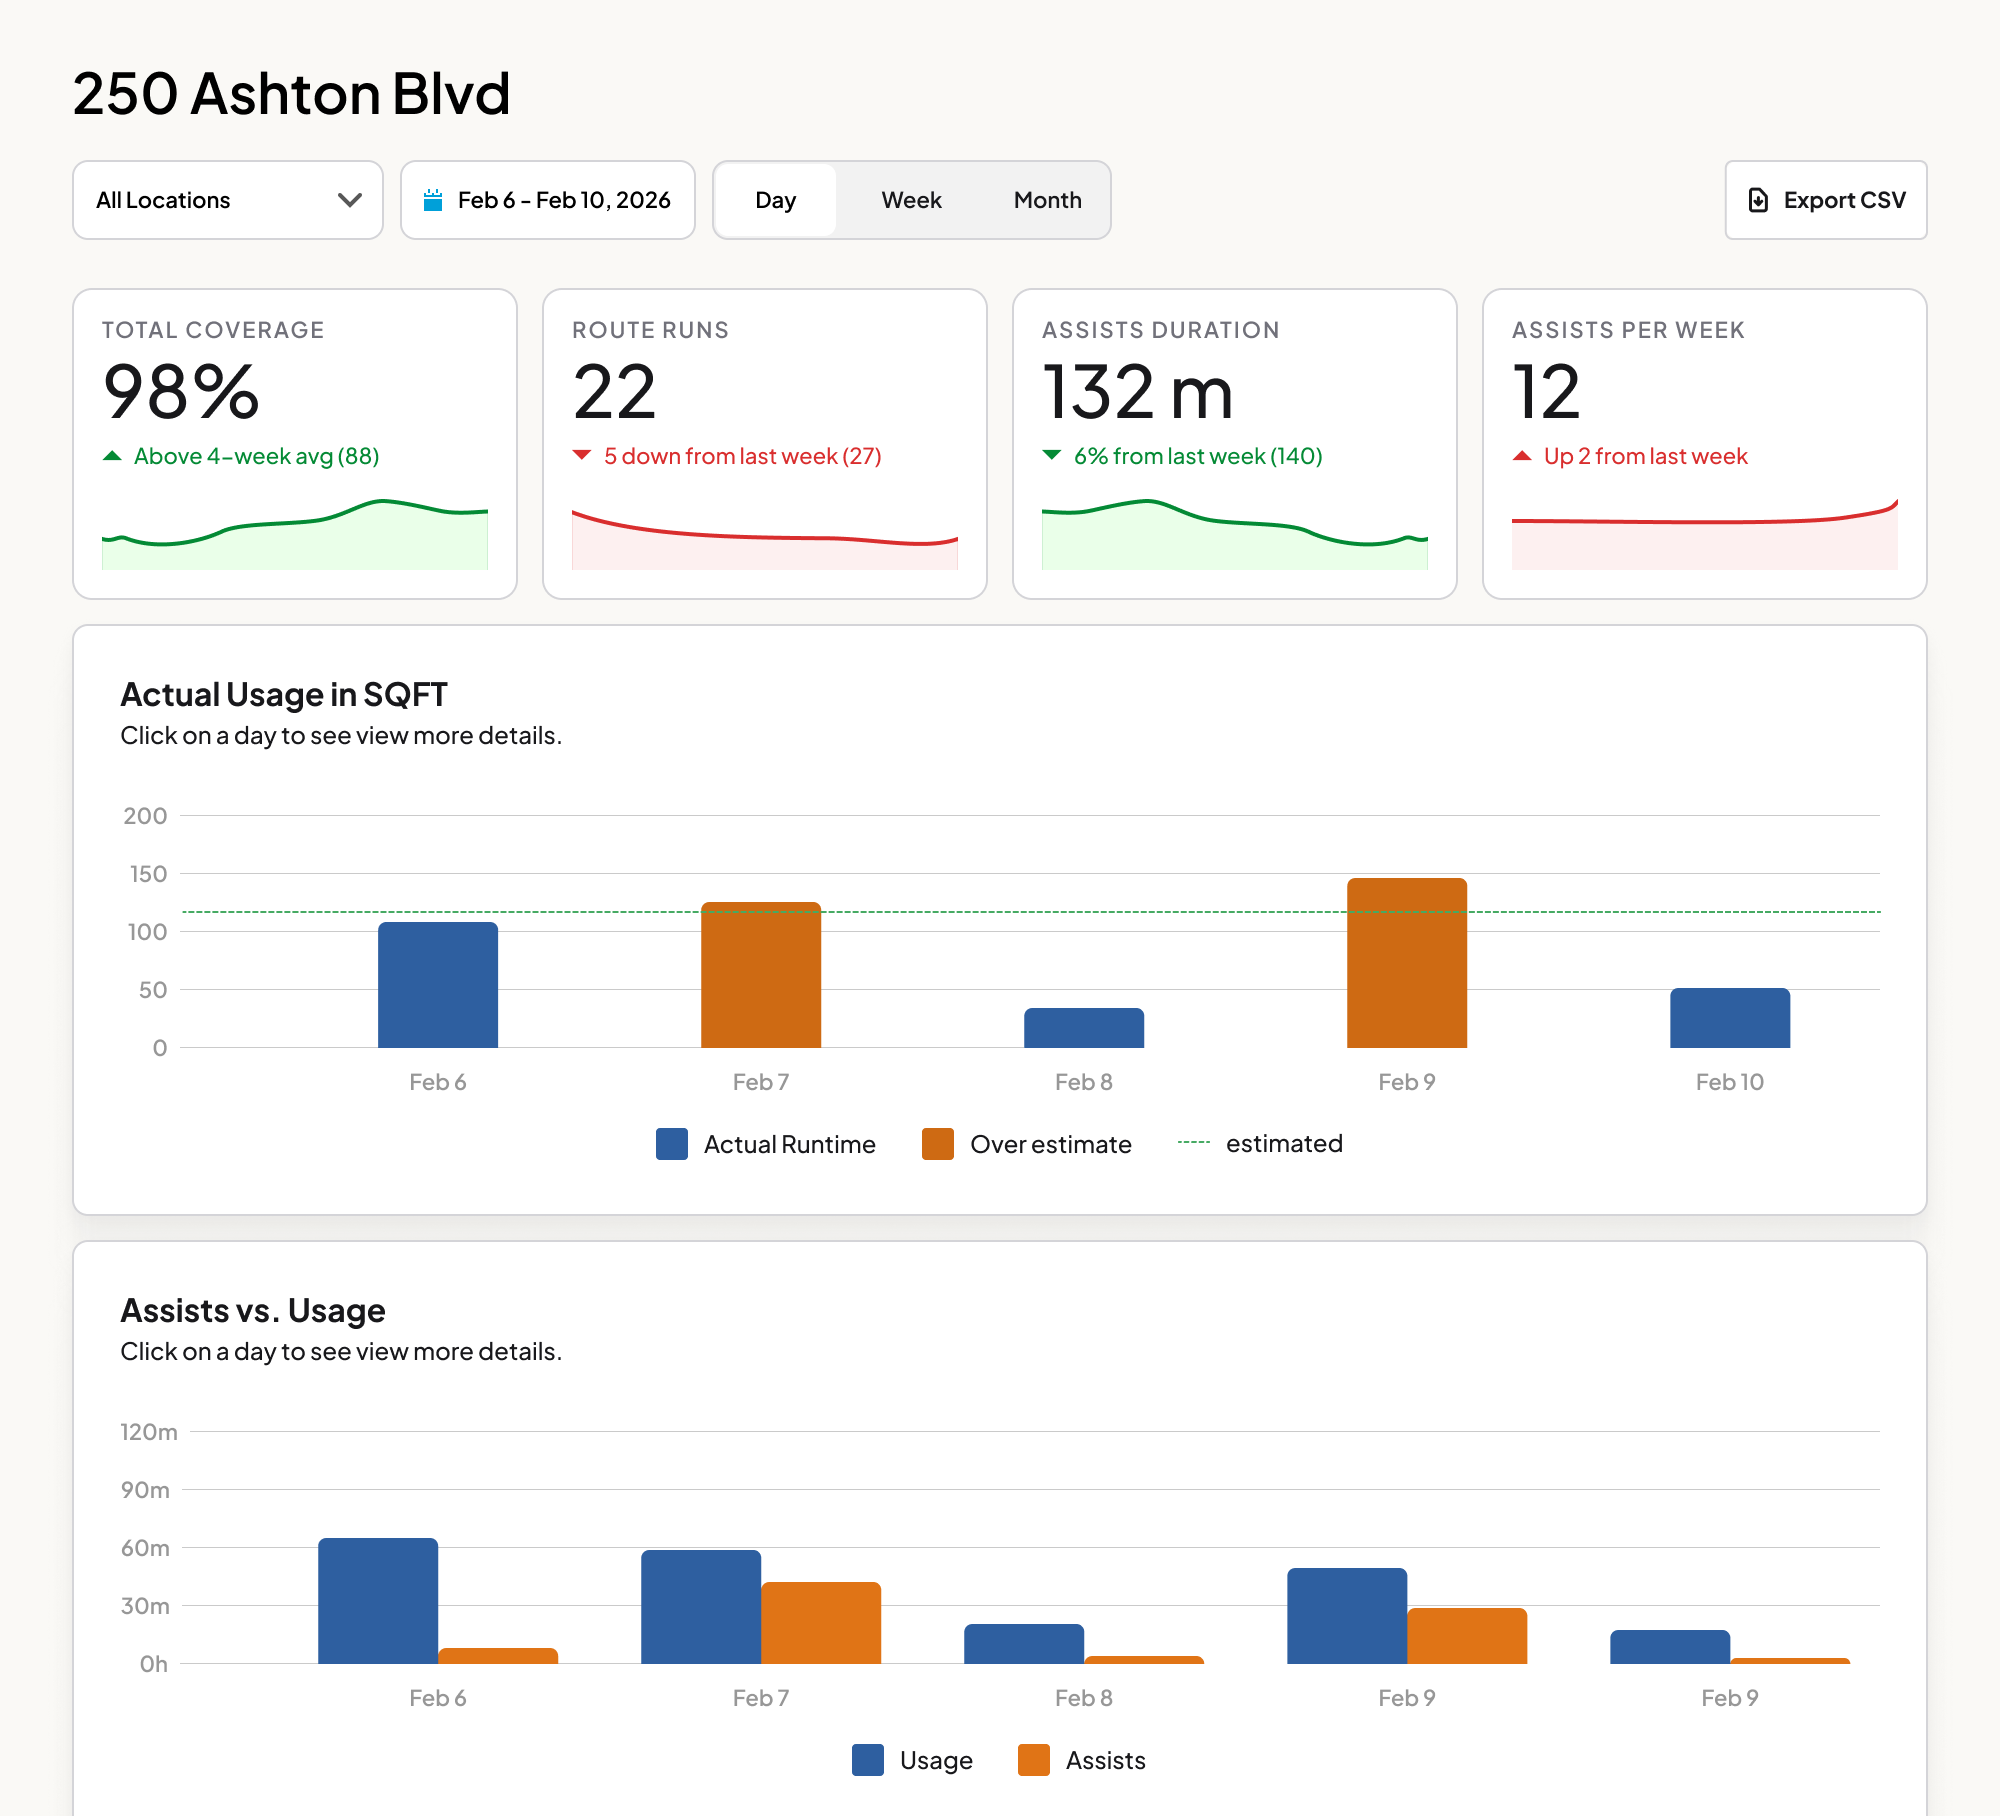
The initial brief was straightforward, build a dashboard that shows ROI. Give clients data proving the robots are worth the investment. We surfaced coverage area, runtime, routes completed and we learned it wasn't enough.
What customer interviews actually revealed
Sitting in on customer-facing calls, a different problem kept surfacing. Distributors weren't losing deals because clients doubted the robot's efficiency. A facilities manager couldn't prove a cleaning happened to a skeptical tenant. A building owner couldn't dispute a false complaint from a lessee.
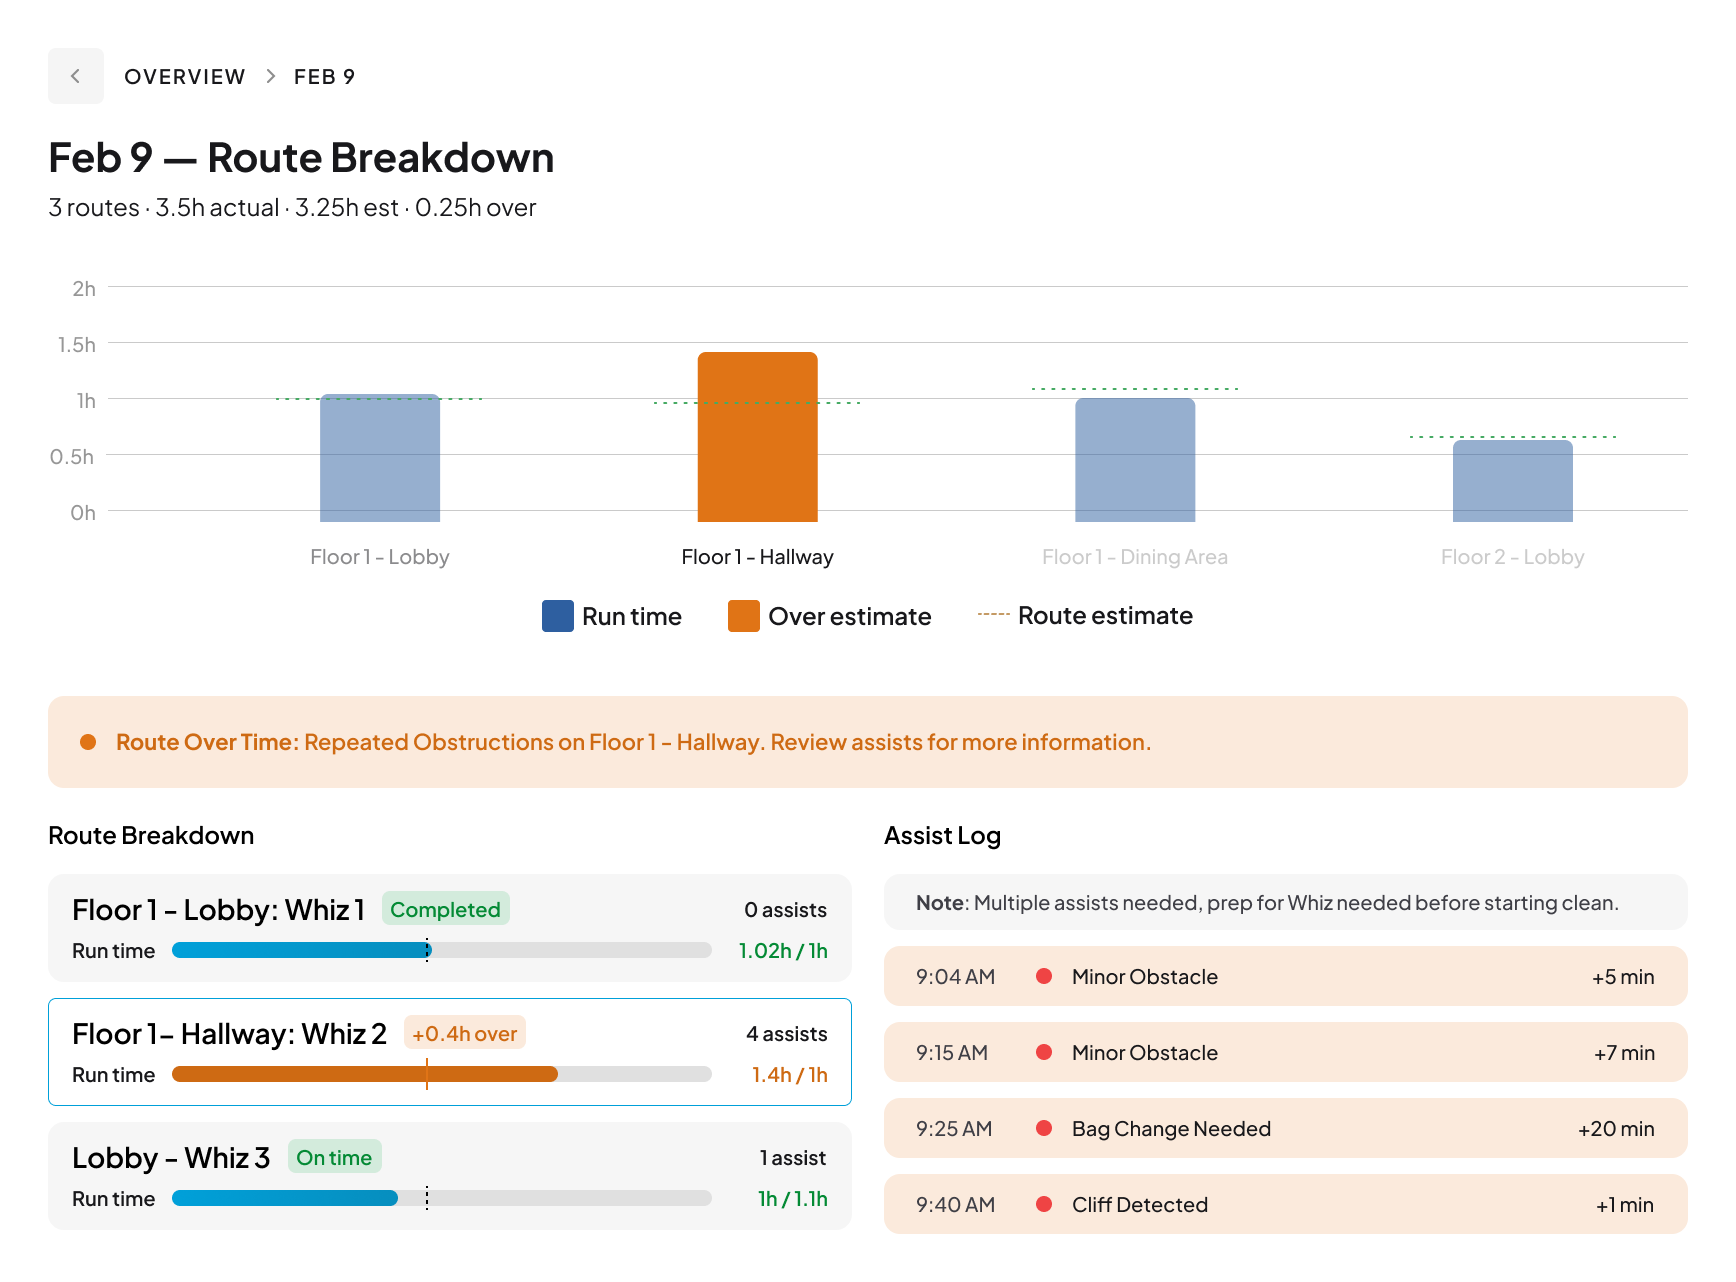
The gap wasn't ROI. It was verifiability. Cleaning has always been taken on faith, no paper trail, no timestamps, no record. Whiz units generated this data. The design problem shifted from showing efficiency metrics to how might we create a defensible record of every clean?
.png)
.png)
